A Intro to Knowledge Graphs
2024-02-16 23:39:01
Introduction to KGs
Introduction
Over the course of the last decade, graph data has become ubiquitous, underpinning everything from consumer facing systems like navigation and social networks, to critical infrastructure, such as supply chains and policing.
Through research, and practical implementation, the concept of knowledge graphs [KG] has been developed to support the extraction of knowledge from data. This knowledge is used to provide context to the data.
It is important to understand that there is a distinction between the 'graph' of knowledge graphs, and a chart, such as you would see when plotting time-series data, for example. A graph is a simple structure where we used nodes (or vertices) connected by relationships (or edges) to create high-fidelity models of a domain [1].
The image below is of a representation of a KG:
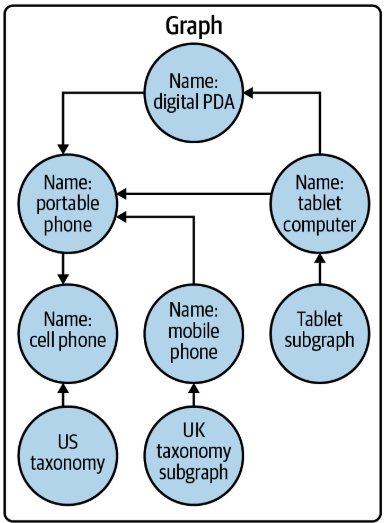
These graphs can be referred to an networks -- they are a powerful way to describe how things are connected.
Some graph models, like the property graph, allow for both nodes and relationships to contain properties. A property graph consists objects or vertices, and a set of arrows or edges, connecting the objects. Vertices and edges can have multiple properties, which are represented as key-value pairs [2]. An example of this kind of structure can be seen if we think about a bank, where the customer accounts can be the vertices, and the transfers between accounts can be the relationships. The data in a graph can be analysed using the connections and relationships between them. Graph analytics, such as PageRank can be used to measure the relative importance of the data, based on the relationships between them.
Property Graphs
As stated, a property graph consists of a set of objects, or vertices, and a set of arrows, or edges, connecting the objects.
Each vertex has a unique identifier and can have:
- A set of outgoing edges.
- A set of incoming edges.
- A collection of properties.
Each edge has a unique identifier and can have:
- An outgoing vertex.
- An incoming vertex.
- A text label that describes the relationship between the two vertices it connects.
- A number of properties.
The figure below illustrates this relationship in a simple property graph which contains two vertices and one edge.
In Fig [2] the vertices have identifiers 1 and 2. Each contains two properties: name and age. The edge is outgoing from 1 and incoming to 2, and the edge has the text label knows and a property type identifying the type of relationship between vertices 1 and 2.
A property graph can have self-edges, which is an edge whose source and destination vertex are the same.
The property graph model is the most popular model for modern databases, and, as such, a popular tool for creating knowledge graphs.
- Nodes can contain zero or more properties, which are key-value pairs, representing entity data, such as the price of an item or a date of birth. Nodes can have zero or more labels, which declares the nodes purpose in the graph, such as representing customers or products.
- Relationships represent how entities interrelate. Relationships have a type, such as "bought" or "liked", and have a direction, for example going from one node to another, or back to the same node. Relationships can contain zero or more properties, which are key-value pairs1 representing some characteristics of the link, such as timestamps or distance. Also, relationships never dangle -- there is always a start and an end node (which can be the same node).
Figure [3] shows a more detailed KG, which is taken directly from [1].
We can see in Fig [3] that each node has a label that represents a role in the graph. We can see that some nodes are labelled as Person, which represents people, and others are labelled as Place, which represents places.
As each node will have properties stored inside, such as name: Rose, and gender: f, which tells us the Rosa is a female person. We can also see that Karl and Fred have nodes with slightly different properties, and this is not a problem2.
We can see in Fig. [3] that the relations are deeper because they have a type, a direction and can have operational properties on them. We can see from the figure that the Person with the property name: Rosa has an outgoing LIVES_IN relationship with the property since: 2020 to the Place node with city: Berlin property.
In the property graph model, there are no limits to the number of nodes or the relationships that connect them. Some nodes are connected in dense, complicated ways, while others can be sparsely connected. The manner of connection is determined by the problem domain. Nodes can also have many properties, or few properties, or even, none at all. Some relationships can have lots of properties, and many have none at all.
Motivation
Recently, there has been increased interest in KG, due, in part because graph technology has accelerated, and also because there is a strong demand to use, and make sense of the data companies and organisations have.
Decision making needs to be quick, but organisations can be slow to react due to the lack of timely and accurate data. Historical data may lose its relevance as time moves forward, so organisations seek new ways to gather and learn from data. Organisations will seek ways to gather rapid insights and recommendations across their business, from customer experiences and product feedback, from patient experiences and outcomes. These insights will allow for new product innovations, heightened fraud detection, and automation. In short, we need contextualised data to generate data knowledge.
KG Definitions
KGs are a specific type of graph, with an emphasis on contextual understanding, meaning they should not be confused with the type of graph used to display information. They are an way to describe real-world details (such as things, places, events) through a linked set of facts. This information is given in a way that is understandable by humans, and by machines. KGs use an operating principle to allow an operator (be that a person, or a computer) to reason about the data in the graph. This operating principle, or organising principle, provides an additional layer of data (metadata) that will add connected context, which can be used to support reasoning and knowledge discovery.
Footnotes
1: A key-value pair (KVP) is a data structure that associates two related pieces of data, a key and a value. A key is a constant that defines the data set. For example, a key could be "gender" or "colour". A value is a variable that belongs to the data set. For example, a value could be "male/female" or "green".
2: If we wanted to make sure that all person nodes have the same property keys, we can apply constraints to the label, ensuring those properties exist, are unique, etc.
References
[1] Knowledge Graphs (Ch.1) - Jesus Barrasa, Amy E. Holder, Jim Webber
[2] Graph Developer's Guide for Property Graphs
For more information, check out my next post.